

Question: The following table of data was analyzed in Quality Engineering [19911992, Vol. 4(1)]. The average particle size of raw material was obtained from 25 successive
The following table of data was analyzed in Quality Engineering [1991€“1992, Vol. 4(1)]. The average particle size of raw material was obtained from 25 successive samples.
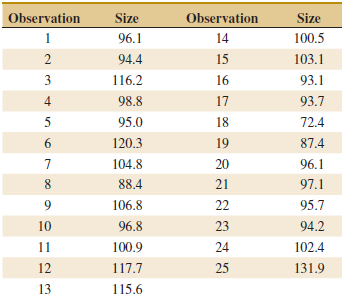
(a) Using all the data, compute trial control limits for individual observations and moving-range charts. Construct the chart and plot the data. Determine whether the process is in statistical control. If not, assume that assignable causes can be found to eliminate these samples and revise the control limits.
(b) Estimate the process mean and standard deviation for the in-control process.
Observation Size Observation Size 1 96.1 14 100.5 94.4 2 15 103.1 3 116.2 16 93.1 4 98.8 17 93.7 72.4 5 95.0 18 87.4 6. 120.3 19 104.8 20 96.1 97.1 88.4 21 9. 106.8 22 95.7 10 96.8 23 94.2 102.4 11 100.9 24 12 117.7 25 131.9 13 115.6
Step by Step Solution
3.38 Rating (185 Votes )
There are 3 Steps involved in it
a The process is out of control The control charts follow Remove the ... View full answer

Get step-by-step solutions from verified subject matter experts