

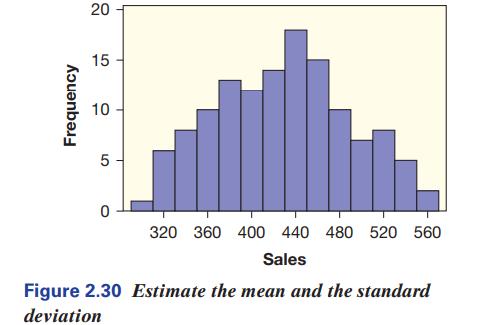
A histogram of total US monthly retail sales, in billions of dollars, for the 129 months starting
Question:
A histogram of total US monthly retail sales, in billions of dollars, for the 129 months starting with January 2009 is shown in Figure 2.30. Is the distribution approximately symmetric and bell-shaped? Use the histogram to give a rough estimate of the mean and standard deviation of monthly US retail sales totals.
Fantastic news! We've Found the answer you've been seeking!
Step by Step Answer:
The histogram is relatively symmetric and bellshaped The mean appears to ...View the full answer

Answered By
Abigael martinez
I have been a tutor for over 3 years and have had the opportunity to work with students of all ages and backgrounds. I have a strong belief that all students have the ability to learn and succeed if given the right tools and support. I am patient and adaptable, and I take the time to get to know each student's individual learning style in order to best support their needs. I am confident in my ability to help students improve their grades and reach their academic goals.
1+ Reviews
10+ Question Solved
Related Book For 
Statistics Unlocking The Power Of Data
ISBN: 9781119682219
3rd Edition
Authors: Robin H Lock, Patti Frazer Lock, Kari Lock Morgan, Eric F Lock, Dennis F Lock
Question Posted:
