

Question: A two-way table is shown for two groups, 1 and 2, and two possible outcomes, A and B. In each case, (a) What proportion of
A two-way table is shown for two groups, 1 and 2, and two possible outcomes, A and B. In each case,
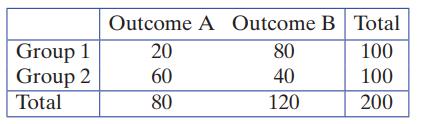
(a) What proportion of all cases had Outcome A?
(b) What proportion of all cases are in Group 1?
(c) What proportion of cases in Group 1 had Outcome B?
(d) What proportion of cases who had Outcome A were in Group 2?
Group 1 Group 2 Total Outcome A Outcome B Total 100 100 200 20 60 80 80 40 120
Step by Step Solution
3.49 Rating (179 Votes )
There are 3 Steps involved in it
a We see that there are 200 cases total and 80 had Outcome A so the proportion with ... View full answer

Get step-by-step solutions from verified subject matter experts