

The graph in Figure 42 shows simultaneously the number of births in this country during two time
Question:
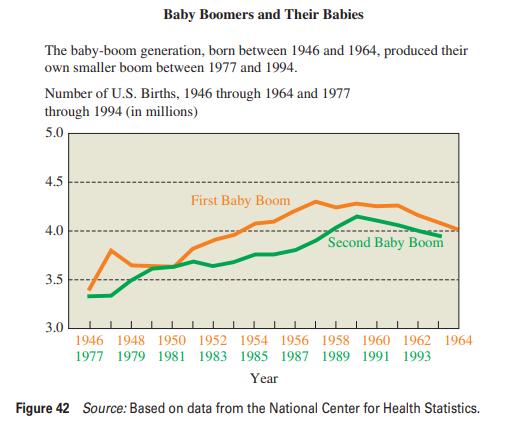
The graph in Figure 42 shows simultaneously the number of births in this country during two time periods: 1946–1964 and 1977–1994. When did the first baby boom peak? When did the second baby boom peak? Why do you think the designer of this display chose to superimpose the two time intervals, rather than use a single time scale from 1946 through 1994?
Step by Step Answer:

This question has not been answered yet.
You can Ask your question!
Related Book For 

Statistical Reasoning For Everyday Life
ISBN: 9780321904645
4th International Edition
Authors: Jeffrey Bennett, William L. Briggs, Mario F. Triola
Question Posted:
