

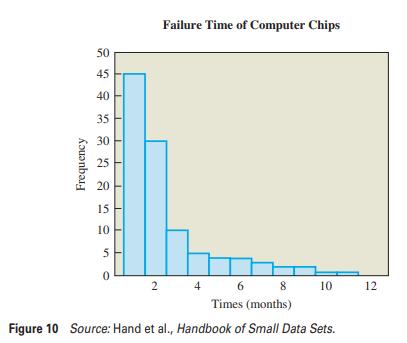
The histogram in Figure 10 shows the time until failure for a sample of 108 computer chips.
Question:
The histogram in Figure 10 shows the time until failure for a sample of 108 computer chips. Over the histogram, draw a smooth curve that captures its general features. Then classify the distribution according to its number of modes and its symmetry or skewness. In words, summarize the meaning of your results.
Step by Step Answer:

This question has not been answered yet.
You can Ask your question!
Related Book For 

Statistical Reasoning For Everyday Life
ISBN: 9780321904645
4th International Edition
Authors: Jeffrey Bennett, William L. Briggs, Mario F. Triola
Question Posted:
