

Question: A company that makes LED light bulbs tests 500 bulbs each day for defects. The number of defective bulbs, along with the proportion of defective
A company that makes LED light bulbs tests 500 bulbs each day for defects. The number of defective bulbs, along with the proportion of defective bulbs for 20 days, is shown in the following table.
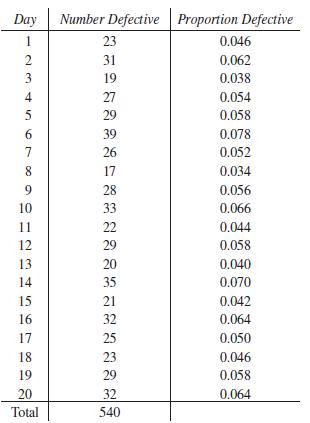
For a p chart, find the values of the central line, UCL, and LCL.
Day Number Defective 1 2 234 in 5 6 7899H2BH 10 11 12 13 14 15 16 17 18 19 20 Total 23 31 19 27 29 39 26 17 28 33 22 29 20 35 21 32 25 23 29 32 540 Proportion Defective 0.046 0.062 0.038 0.054 0.058 0.078 0.052 0.034 0.056 0.066 0.044 0.058 0.040 0.070 0.042 0.064 0.050 0.046 0.058 0.064
Step by Step Solution
3.40 Rating (166 Votes )
There are 3 Steps involved in it
To create a pchart we need to calculate the proportion of defective bulbs for each day Day ... View full answer

Get step-by-step solutions from verified subject matter experts