

Question: Five AC adaptors that are used to charge batteries of a cellular phone are taken from the production line each 15 min and tested for
Five AC adaptors that are used to charge batteries of a cellular phone are taken from the production line each 15 min and tested for their direct-current output voltage. The output voltages for 24 sample subgroups are as follows:
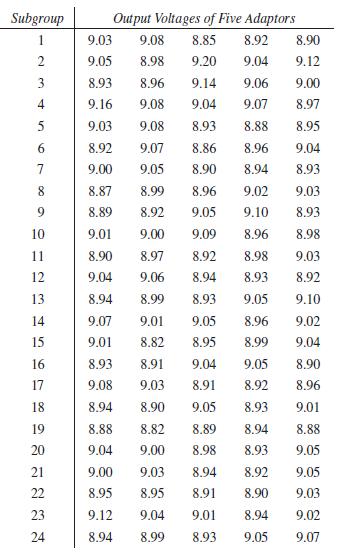
Plot the R chart.
Subgroup 1 2 3 4 5 6 7 8 9 10 11 12 13 14 15 16 17 18 19 20 21 22 23 24 Output Voltages of Five Adaptors 9.03 9.08 8.85 8.92 8.90 9.05 8.98 9.20 9.04 9.12 8.93 8.96 9.14 9.06 9.00 9.16 9.08 9.04 9.07 8.97 9.03 9.08 8.93 8.88 8.95 8.92 9.07 8.86 8.96 9.04 9.00 9.05 8.90 8.94 8.93 8.99 8.96 9.02 9.03 8.92 9.05 9.10 8.93 9.00 9.09 8.96 8.98 8.97 8.92 8.98 9.03 9.06 8.94 8.93 8.92 8.94 8.99 8.93 9.05 9.10 9.07 9.01 9.05 8.96 9.01 8.82 8.95 8.99 8.93 8.91 9.04 9.05 8.90 9.08 9.03 8.91 8.92 8.96 8.94 8.90 9.05 8.93 9.01 8.88 8.82 8.89 8.94 8.88 9.04 9.00 8.98 8.93 9.05 9.00 9.03 8.94 8.92 9.05 8.95 8.95 8.91 8.90 9.03 9.12 9.04 9.01 8.94 9.02 8.94 8.99 8.93 9.05 9.07 8.87 8.89 9.01 8.90 9.04 9.02 9.04
Step by Step Solution
3.36 Rating (165 Votes )
There are 3 Steps involved in it
To plot the R chart we first need to calculate the range of each subgroup Range of subgroup 1 023 Ra... View full answer

Get step-by-step solutions from verified subject matter experts