

Question: For a production process for which there is a great deal of data since its last modification, the population mean and population standard deviation
For a production process for which there is a great deal of data since its last modification, the population mean μ and population standard deviation σ are assumed known. For such a process, we have the following values (using additional statistical analysis):
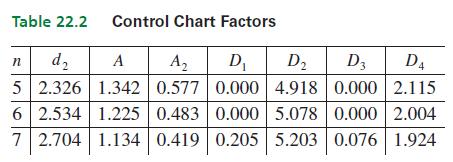
The values of A, d2, D2, and D1 are found in the table of control chart factors in Example 2 (Table 22.2).
For the robot link samples of Exercise 13, find the central line, UCL, and LCL for the range.
Data from Exercises 13
In the production of robot links and tests for their lengths, it has been found that μ = 2.725in. and σ = 0.032in. Find the central line, UCL, and LCL for the mean if the sample subgroup size is 5.
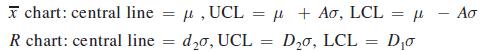
x chart: central line R chart: central line = do, UCL = , UCL = + Ao, LCL = - Ao Do, LCL Do = =
Step by Step Solution
3.43 Rating (169 Votes )
There are 3 Steps involved in it
To find the central line UCL and LCL for the range we need to use the fo... View full answer

Get step-by-step solutions from verified subject matter experts