

Question: Graphically show that y = 2 x and y = log2 x are inverse functions. (See Example 9 of Section 13.2.) Data from Example 9
Graphically show that y = 2x and y = log2 x are inverse functions. (See Example 9 of Section 13.2.)
Data from Example 9 of Section 13.2.
The functions y = 2x and y = log2 x are inverse functions. We show this by solving y = 2x for x and then interchanging x and y. Writing y = 2x in logarithmic form gives us x = log2 y. Then interchanging x and y, we have y = log2 x, which is the inverse function. Making a table of values for each function, we have
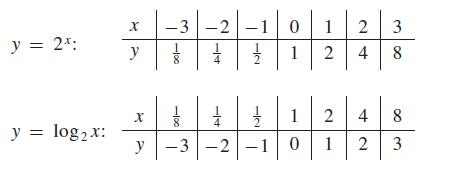
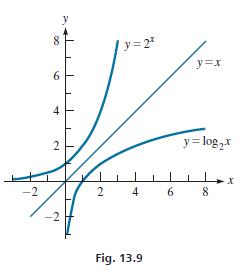
We see that the coordinates are interchanged. In Fig. 13.9, note that the graphs of these two functions reflect each other across the line y = x.
y = 2x: y = logx: X -3 y X -100 -2-1 0 1 2 3 11 1 2 4 8 11 1 2 4 2 -2-1 0 1 8 y-3-2 4 2 8 3
Step by Step Solution
3.43 Rating (166 Votes )
There are 3 Steps involved in it
To show that y 2x and y log2 x are inverse functions we need to show that t... View full answer

Get step-by-step solutions from verified subject matter experts