

Question: In a random sample, 500 adults aged 30+ were asked which of the following environmentally friendly activities they do or plan to do soon. The
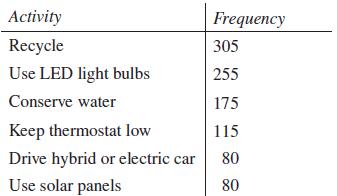
In a random sample, 500 adults aged 30+ were asked which of the following environmentally friendly activities they do or plan to do soon. The results are summarized below:
Is it appropriate to use a pie chart for these data? Explain why or why not.
Activity Recycle Use LED light bulbs Conserve water Keep thermostat low Drive hybrid or electric car Use solar panels Frequency 305 255 175 115 80 80
Step by Step Solution
★★★★★
3.48 Rating (164 Votes )
There are 3 Steps involved in it
1 Expert Approved Answer
Step: 1 Unlock

It is appropriate to use a pie chart for these data A pie chart is a circular graph that i... View full answer
Question Has Been Solved by an Expert!
Get step-by-step solutions from verified subject matter experts
Step: 2 Unlock
Step: 3 Unlock