

Question: In a random sample, 800 smartphone owners were asked which type of smartphone they would choose with their next purchase (if they could only choose
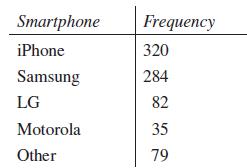
In a random sample, 800 smartphone owners were asked which type of smartphone they would choose with their next purchase (if they could only choose one). The results are summarized below:
Make a bar graph of these data using the frequencies.
Smartphone iPhone Samsung LG Motorola Other Frequency 320 284 82 35 79
Step by Step Solution
★★★★★
3.44 Rating (179 Votes )
There are 3 Steps involved in it
1 Expert Approved Answer
Step: 1 Unlock

Here is how you can do it Step 1 Draw a horizontal axis and label i... View full answer
Question Has Been Solved by an Expert!
Get step-by-step solutions from verified subject matter experts
Step: 2 Unlock
Step: 3 Unlock