

In Example 4, change the y (mg of drug/dL of blood) values to 8.7, 8.4, 7.7, 7.3,
Question:
In Example 4, change the y (mg of drug/dL of blood) values to 8.7, 8.4, 7.7, 7.3, 5.7, 5.2. Then proceed to find y as a function of t, as in Example 4.
Data from Example 4
In a research project to determine the amount of a drug that remains in the bloodstream after a given dosage, the amounts y (in mg of drug/dL of blood) were recorded after t h, as shown in the table below. Find the least-squares line for these data, expressing y as a function of t. Sketch the graph of the line and data points. The calculations are as follows:
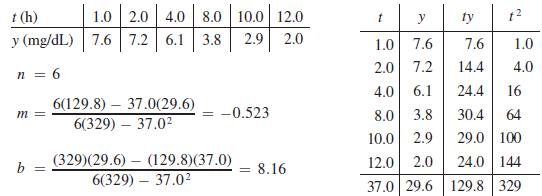
The equation of the least-squares line is y = −0.523t + 8.16. This line is useful in determining the amount of the drug in the bloodstream at any given time. For example, using the regression line, the predicted amount of drug in the bloodstream after 13 hours is 1.4 mg/dL (extrapolation).
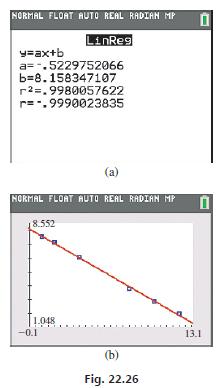
The calculator display of the regression line and its graph through the scatterplot are shown in Fig. 22.26(a) and (b), respectively. Note that r is very close to −1 and r2 is close to 1 (or 100%). This indicates a very good fit.
Step by Step Answer:
ANSWER Using the new values of y the updated data table ...View the full answer


Basic Technical Mathematics
ISBN: 9780137529896
12th Edition
Authors: Allyn J. Washington, Richard Evans
