

Question: In Example 4(b), change to > and then graph the resulting inequality. Data from Example 4(b) To graph x 1, we follow the
In Example 4(b), change ≤ to > and then graph the resulting inequality.
Data from Example 4(b)
To graph x ≤ 1, we follow the same basic procedure as in part (a), except that we use a solid circle and the arrowhead points to the left. See Fig. 17.1(b). The solid circle shows that the point is part of the indicated solution.
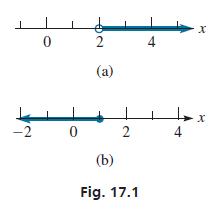
-2 0 0 2 (a) 2 (b) Fig. 17.1 4 4 X x
Step by Step Solution
★★★★★
3.42 Rating (158 Votes )
There are 3 Steps involved in it
1 Expert Approved Answer
Step: 1 Unlock

To graph x 1 we start by drawing a number line and marking a point at 1 with an open circle Since ... View full answer
Question Has Been Solved by an Expert!
Get step-by-step solutions from verified subject matter experts
Step: 2 Unlock
Step: 3 Unlock