

Question: Represent the data graphically. The time required for a sum of money to double in value, when compounded annually, is given as a function of
Represent the data graphically.
The time required for a sum of money to double in value, when compounded annually, is given as a function of the interest rate in the following table:
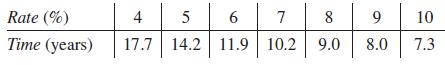
Rate (%) Time (years) 4 5 6 7 8 17.7 14.2 11.9 10.2 9.0 9 8.0 10 7.3
Step by Step Solution
★★★★★
3.40 Rating (178 Votes )
There are 3 Steps involved in it
1 Expert Approved Answer
Step: 1 Unlock

To represent the data graphically we can create a scatter plot with the ... View full answer
Question Has Been Solved by an Expert!
Get step-by-step solutions from verified subject matter experts
Step: 2 Unlock
Step: 3 Unlock