

Question: Represent the data graphically. The torque T of an engine, as a function of the frequency f of rotation, was measured as follows: f(r/min) T
Represent the data graphically.
The torque T of an engine, as a function of the frequency f of rotation, was measured as follows:
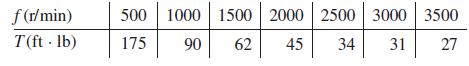
f(r/min) T (ft. lb) 500 1000 1500 2000 2500 3000 3500 175 90 62 45 34 31 27
Step by Step Solution
★★★★★
3.49 Rating (159 Votes )
There are 3 Steps involved in it
1 Expert Approved Answer
Step: 1 Unlock

To represent the data graphically we can use a scat... View full answer
Question Has Been Solved by an Expert!
Get step-by-step solutions from verified subject matter experts
Step: 2 Unlock
Step: 3 Unlock