

Question: Sketch the graphs of the given functions by use of the basic curve forms (Figs. 10.23, 10.24, 10.25, and 10.26). See Example 1. y =
Sketch the graphs of the given functions by use of the basic curve forms (Figs. 10.23, 10.24, 10.25, and 10.26). See Example 1.
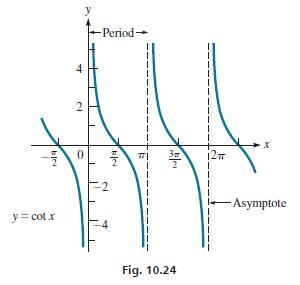
y = 3cot x
Data from Example 1:
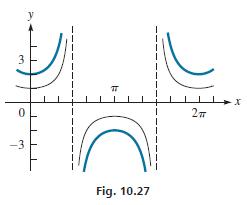
Sketch the graph of y = 2sec x.
First, we sketch in y = sec x, the curve shown in black in Fig. 10.27. Then we multiply the y-values of this secant function by 2. Although we can only estimate these values and do this approximately, a reasonable graph can be sketched this way. The desired curve is shown in blue in Fig. 10.27.
klei y = cotx 4 2 0 -Period -2 Blei E Fig. 10.24 12 -Asymptote
Step by Step Solution
3.29 Rating (158 Votes )
There are 3 Steps involved in it
First we assume some values of x in degrees then calculate the values of y3cotx x y3c... View full answer

Get step-by-step solutions from verified subject matter experts