

Question: Use a calculator to find a regression model for the given data. Graph the scatterplot and regression model on the calculator. Use the regression model
Use a calculator to find a regression model for the given data. Graph the scatterplot and regression model on the calculator. Use the regression model to make the indicated predictions.
In Example 1, change the V (volume of the gas) values to 19.9, 24.5, 29.4, 39.4, 56.0. Then find a power regression model as in Example 1
Data from Example 1
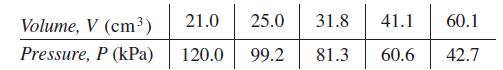
In a physics experiment, the pressure P and volume V of a gas were measured at constant temperature. The resulting data are shown in the table below and plotted on a calculator in Fig. 22.28.
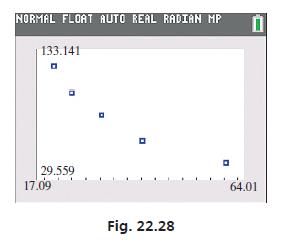
Based on the curved downward trend of the points, the types of regression models that are reasonable to try here are logarithmic, exponential, and power. After trying all three, the power regression model clearly fits the data the best. The power regression equation is y = 2382.57x−0.9831 as shown in Fig. 22.29(a). The graph of the model through the scatterplot is shown in Fig. 22.29(b). The fact that r is close to –1 and r2 is close to 1 indicate the model fits the data very well.
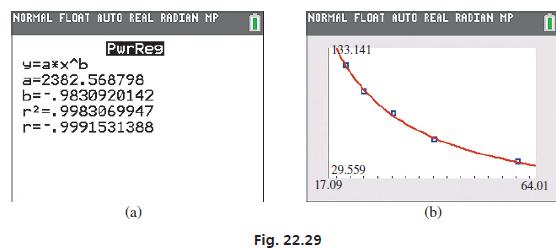
Using the variables in our problem, we can rewrite the regression equation as P = 2382.57V −0.9831. This can be used to predict either variable when given the other. For example, to predict the pressure when the volume is 56.0cm3, we get P = 2382.57(56.0)−0.9831 = 45.5kPa (interpolation).
Volume, V (cm) Pressure, P (kPa) 21.0 120.0 25.0 31.8 41.1 60.1 99.2 81.3 60.6 42.7
Step by Step Solution
3.24 Rating (145 Votes )
There are 3 Steps involved in it

Get step-by-step solutions from verified subject matter experts