

Question: The table below displays data taken from a study comparing self-reported smoking status with measured serum cotinine level [66]. As part of the study, cotinine
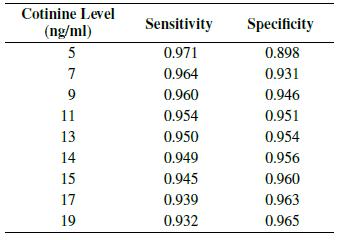
The table below displays data taken from a study comparing self-reported smoking status with measured serum cotinine level [66]. As part of the study, cotinine level was used as a diagnostic tool for predicting smoking status; the self-reported status was considered to be true. For a number of different cutoff points, the observed sensitivities and specificities are listed below.
(a) As the cutoff point is raised, how does the sensitivity of the test change? How does the specificity change?
(b) As the cutoff point is raised, how does the probability of a false positive result change? How does the probability of a false negative result change?
(c) Use these data to construct an ROC curve.
(d) Based on the graph, what value of serum cotinine level would you choose as an optimal cutoff point for predicting smoking status? Why?
(e) If you want the probability of a false positive test result to be no higher than 4%, what is the sensitivity that could be achieved?
Cotinine Level (ng/ml) Sensitivity Specificity 5 0.971 0.898 7 0.964 0.931 9 0.960 0.946 11 0.954 0.951 13 0.950 0.954 14 0.949 0.956 15 0.945 0.960 17 0.939 0.963 19 0.932 0.965
Step by Step Solution
There are 3 Steps involved in it

Get step-by-step solutions from verified subject matter experts