

Question: Fuel effi ciency Refer to the previous exercise. Th e Minitab dotplot below shows the diff erence (HighwayCity) in EPA mileage ratings for each of
Fuel effi ciency Refer to the previous exercise. Th e Minitab dotplot below shows the diff erence (Highway—City) in EPA mileage ratings for each of the 24 car models from Example 2.4. What does the graph tell us about fuel economy in the city versus on the highway for these car models? Be specifi c.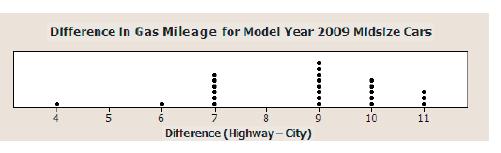
.......a Difference In Gas Mileage for Model Year 2009 Midsize Cars 16 Difference (Highway - City) ... 10 11
Step by Step Solution
There are 3 Steps involved in it
1 Expert Approved Answer
Step: 1 Unlock

Question Has Been Solved by an Expert!
Get step-by-step solutions from verified subject matter experts
Step: 2 Unlock
Step: 3 Unlock