Many evaluations of Poisson mixture models consider aggregated data, for example numbers of consumers making 0,1,2, etc.
Question:
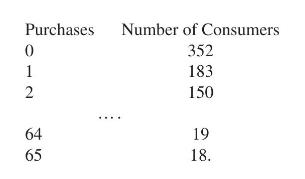
Many evaluations of Poisson mixture models consider aggregated data, for example numbers of consumers making 0,1,2, etc. purchases. Brockett et al. (1996) present such data for purchases of 'salty snacks', which are re-analysed by Kaplon (2010). Thus consider total subjects in a consumer panel making \(0,1,2, \ldots, 64,65\) purchases, namely data in the form
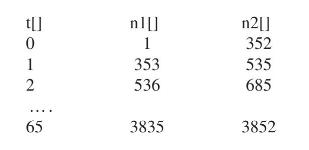
To analyse such data in BUGS they can be disaggregated to unit level, as demonstrated in the following code which fits a single mean Poisson model. There are \(n=3852\) subjects in all. The input data are in the form
with the code to fit a single mean Poisson model (and obtain predictions) then being
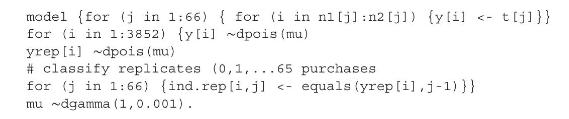
Add code to obtain the predicted numbers of subjects making \(0,1,2, \ldots, 65\) purchases, say \(\left\{f_{\text {rep }, j}, j=1,66\right\}\) and use a predictive \(p\)-test to compare these with the observed numbers \(\left\{f_{o b s, j}, j=1,66\right\}\). Compare Poisson-gamma and Poisson-lognormal mixtures to establish which has the lower number of extreme predictive \(p\)-tests from the 66 (either under 0.05 or over 0.95 ). As mentioned above the appropriate indicator for count data is \(I\left(f_{\text {rep }, j . j}^{(t)}
Step by Step Answer: