

Question: Why so small? (a) Make a scatterplot of the following data: (b) Use the method of Example 4.5 (page 158) to show that the correlation
Why so small?
(a) Make a scatterplot of the following data: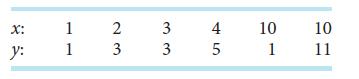
(b) Use the method of Example 4.5 (page 158) to show that the correlation is about 0.5.
(c) What feature of the data is responsible for reducing the correlation to this value despite a strong straight-line association between x and y in most of the observations?
x: y: 1 1 2 23 3 4 5 11 10 10 1 11 45 33
Step by Step Solution
There are 3 Steps involved in it
1 Expert Approved Answer
Step: 1 Unlock

Question Has Been Solved by an Expert!
Get step-by-step solutions from verified subject matter experts
Step: 2 Unlock
Step: 3 Unlock