

Question: Boston Subway Corporation is a natural monopoly. The graph shows the demand curve, the marginal revenue curve, the marginal cost curve and the average
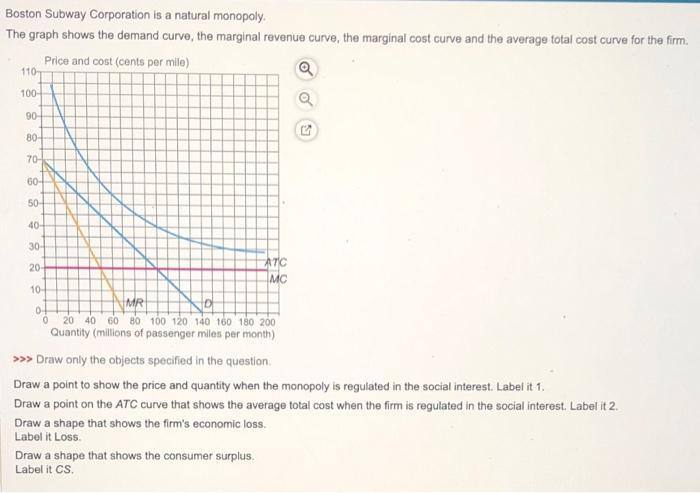
Boston Subway Corporation is a natural monopoly. The graph shows the demand curve, the marginal revenue curve, the marginal cost curve and the average total cost curve for the firm. Price and cost (cents per mile) 110 100- 90- 80- 70- 60- 50- 40- 30- 20- 10- XXXX 0+ 0 MR 20 40 60 80 100 120 140 160 180 200 Quantity (millions of passenger miles per month) ATC MC >>> Draw only the objects specified in the question. Draw a point to show the price and quantity when the monopoly is regulated in the social interest. Label it 1. Draw a point on the ATC curve that shows the average total cost when the firm is regulated in the social interest. Label it 2. Draw a shape that shows the firm's economic loss. Label it Loss. Draw a shape that shows the consumer surplus. Label it CS.
Step by Step Solution
3.47 Rating (154 Votes )
There are 3 Steps involved in it
When monopoly is controlled for the greater good the area where marginal cost MC equals demand cu... View full answer

Get step-by-step solutions from verified subject matter experts