

Question: Assuming the data in the scatterplot is linear, summarize the strength of the linear relationship between two variables according to the guidelines given in Table
Assuming the data in the scatterplot is linear, summarize the strength of the linear relationship between two variables according to the guidelines given in Table 8.1 when the sample correlation is
(a) ???? = −0.12.
(b) ???? = 0.89.
(c) ???? = −0.93.
(d) ???? = 0.33.
(e) ???? = 0.67.
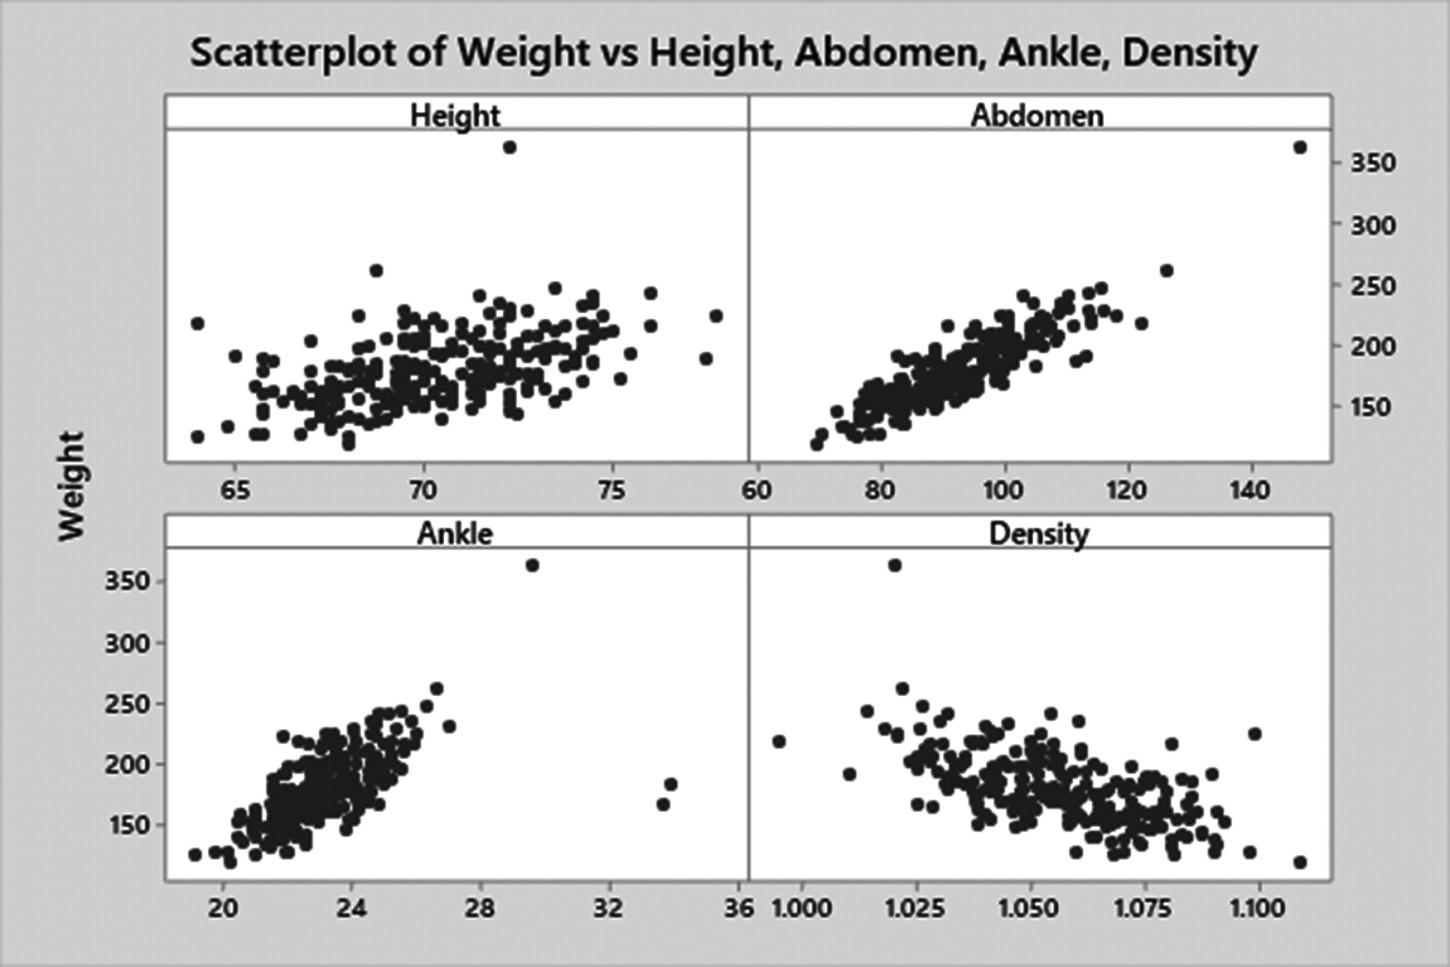
Weight 350 300 250 200- 150 Scatterplot of Weight vs Height, Abdomen, Ankle, Density Height Abdomen 65 70 Ankle 20 24 28 75 60 80 100 120 140 Density 32 -2 36 1.000 1.025 1.050 1.075 1.100 350 300 250 200 150
Step by Step Solution
There are 3 Steps involved in it
1 Expert Approved Answer
Step: 1 Unlock

Question Has Been Solved by an Expert!
Get step-by-step solutions from verified subject matter experts
Step: 2 Unlock
Step: 3 Unlock