

Question: Transformed Data In addition to testing for a linear correlation between x and y, we can often use transformations of data to explore other relationships.
Transformed Data In addition to testing for a linear correlation between x and y, we can often use transformations of data to explore other relationships. For example, we might replace each x value by x2 and use the methods of this section to determine whether there is a linear correlation between y and x2. Given the paired data in the accompanying table, construct the scatterplot and then test for a linear correlation between y and each of the following. Which case results in the largest value of r?
a.x b.x2 c.log x d.1x e.1>x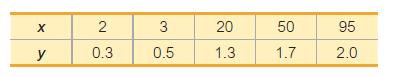
x 2 3 20 50 95 y 0.3 0.5 1.3 1.7 2.0
Step by Step Solution
There are 3 Steps involved in it
1 Expert Approved Answer
Step: 1 Unlock

Question Has Been Solved by an Expert!
Get step-by-step solutions from verified subject matter experts
Step: 2 Unlock
Step: 3 Unlock