

Question: Use the data cited in Exercise 5.3.1. Imagine we take samples of size 5, 25, 50, 100, and 500 from the women in this age
Use the data cited in Exercise 5.3.1. Imagine we take samples of size 5, 25, 50, 100, and 500 from the women in this age group.
(a) Calculate the standard error for each of these sampling scenarios.
(b) Discuss how sample size affects the standard error estimates calculated in part
(a) and the potential implications this may have in statistical practice.
5.4.1 The study cited in Exercises 5.3.1 and 5.3.2 gives the following data on serum cholesterol levels in U.S. females: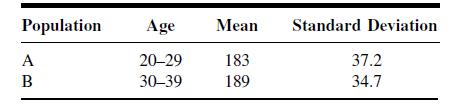
Use these estimates as the mean and standard deviation for the respective U.S. populations.
Suppose we select a simple random sample of size 50 independently from each population. What is the probability that the difference between sample means will be more than 8?
Population Age Mean Standard Deviation A 20-29 183 37.2 B 30-39 189 34.7
Step by Step Solution
There are 3 Steps involved in it

Get step-by-step solutions from verified subject matter experts