

Question: Use the normal probability plot given in Figure 12.9 resulting from a single-factor analysis of variance with four treatments to check the normality assumption. Is
Use the normal probability plot given in Figure 12.9 resulting from a single-factor analysis of variance with four treatments to check the normality assumption. Is it reasonable to assume that the error term is normally distributed? Explain.
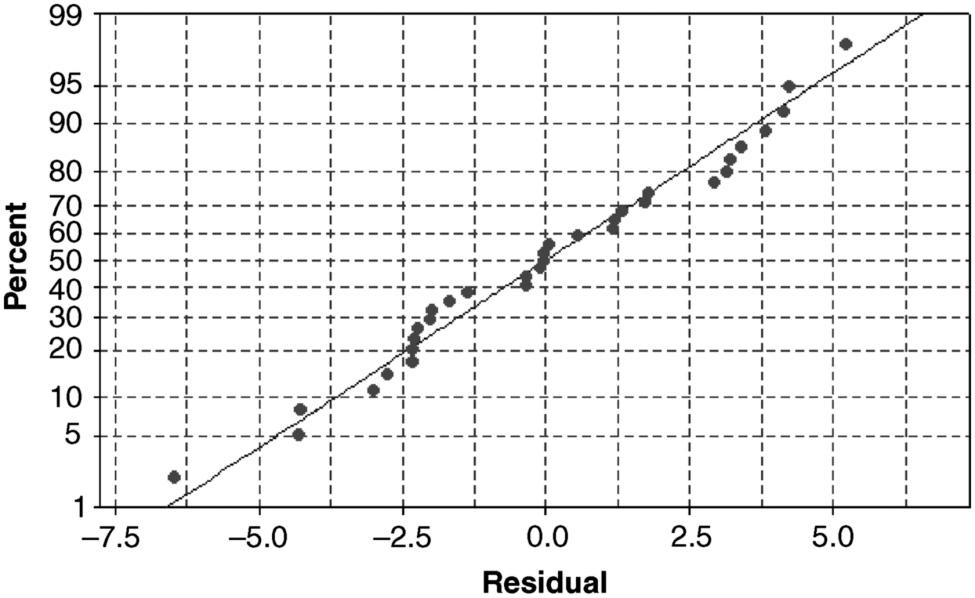
Percent 99 95 90 80 70 60 50 RODDON DE 40 30 20 10 5 -7.5 -5.0 -2.5 0.0 2.5 5.0 Residual
Step by Step Solution
There are 3 Steps involved in it
1 Expert Approved Answer
Step: 1 Unlock

Question Has Been Solved by an Expert!
Get step-by-step solutions from verified subject matter experts
Step: 2 Unlock
Step: 3 Unlock