

Question: Using the five-number summary given in Table 4.20 (a) construct an outlier boxplot. (b) describe the general shape of the distribution suggested by the boxplot
Using the five-number summary given in Table 4.20
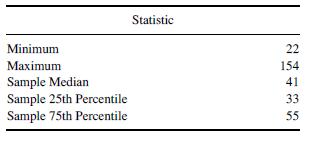
(a) construct an outlier boxplot.
(b) describe the general shape of the distribution suggested by the boxplot in part (a).
(c) estimate the interquartile range.
(d) determine whether or not there are any extreme outliers in the data set.
Minimum Maximum Sample Median Sample 25th Percentile Sample 75th Percentile Statistic 22 154 41 33 55
Step by Step Solution
There are 3 Steps involved in it
1 Expert Approved Answer
Step: 1 Unlock

Question Has Been Solved by an Expert!
Get step-by-step solutions from verified subject matter experts
Step: 2 Unlock
Step: 3 Unlock