

A sample of 10,001 federal income tax returns with errors has been collected by the Internal Revenue
Question:
A sample of 10,001 federal income tax returns with errors has been collected by the Internal Revenue Service (IRS) for analysis. A portion of the data is shown in the table below, and the full data set is in the file fedtax_errors.
Each tax payment error is noted to be either an underpayment or an overpayment.
Underpayments are also denoted as positive tax payment error values and overpayments as negative tax payment error values.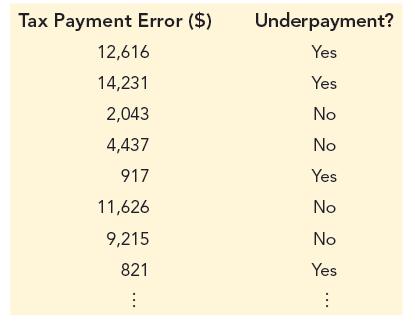
a. Sort the data by the Underpayment? variable to group the underpayment values separately from the overpayment values.
b. Calculate the mean and standard deviation for tax payment errors that are overpayments.
c. Calculate the mean and standard deviation for tax payment errors that are underpayments.
d. Create a frequency polygon to compare the distribution of federal tax overpayments to the distribution of federal tax underpayments. Use bin widths of $2000 and start with $0. Describe any differences you see in these distributions based on the frequency polygon.
Step by Step Answer:


Business Analytics
ISBN: 9780357902219
5th Edition
Authors: Jeffrey D. Camm, James J. Cochran, Michael J. Fry, Jeffrey W. Ohlmann
