

Question: A scatterplot shows relationships between variables. The following scatterplot graphs the relationship between number of users in the system and system response time. Correlation determines
A scatterplot shows relationships between variables. The following scatterplot graphs the relationship between number of users in the system and system response time. Correlation determines the extent to which variables are related to each other. Which variable is the X value? Which variable is the Y variable? How are these data points related?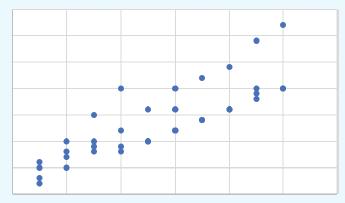
Step by Step Solution
★★★★★
3.45 Rating (161 Votes )
There are 3 Steps involved in it
1 Expert Approved Answer
Step: 1 Unlock

The X variable is number ... View full answer
Question Has Been Solved by an Expert!
Get step-by-step solutions from verified subject matter experts
Step: 2 Unlock
Step: 3 Unlock