

Question: Figure 15.39 shows the Solver Sensitivity Report for the Markowitz portfolio model (Example 14.10). a. Explain how to interpret the Lagrange multiplier value for the
Figure 15.39 shows the Solver Sensitivity Report for the Markowitz portfolio model (Example 14.10).
a. Explain how to interpret the Lagrange multiplier value for the target portfolio return.
b. Suppose the target return is increased from 10% to 11%. How much is the minimum portfolio variance predicted to increase using the Lagrange Multiplier value?
c. Re-solve the model with the target return of 11%. How much does the minimum variance actually change?
Data from Figure 15.39
Markowitz Model Sensitivity Report
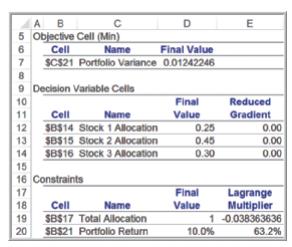
A B 5 Objective Cell (Min) 6 7 8 12 13 14 Cell $C$21 Portfolio Variance 9 Decision Variable Cells 10 11 15 16 17 18 19 20 Name Cell Name $B$14 Stock 1 Allocation $B$15 Stock 2 Allocation $B$16 Stock 3 Allocation Constraints Cell Name $B$17 Total Allocation $B$21 Portfolio Return D Final Value 0.01242246 Final Value 0.25 0.45 0.30 Final Value E 10.0% Reduced Gradient 0.00 0.00 0.00 Lagrange Multiplier 1 -0.038363636 63.2%
Step by Step Solution
3.44 Rating (173 Votes )
There are 3 Steps involved in it
a The Lagrange multiplier is only an approximate indicator of the shadow ... View full answer

Get step-by-step solutions from verified subject matter experts