

Question: Looking at the data and information in the Excel file TV Viewing Survey, state some examples of interesting hypothesis tests by proposing null and alternative
Looking at the data and information in the Excel file TV Viewing Survey, state some examples of interesting hypothesis tests by proposing null and alternative hypotheses similar to those in Example 7.2.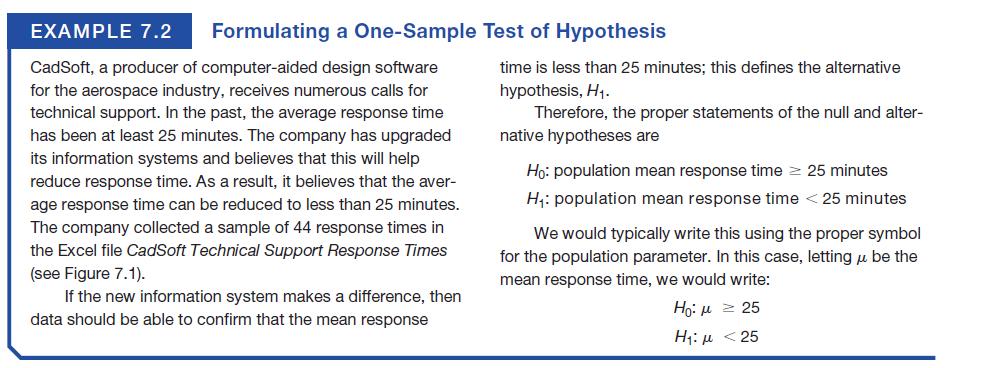
Figure 7.1
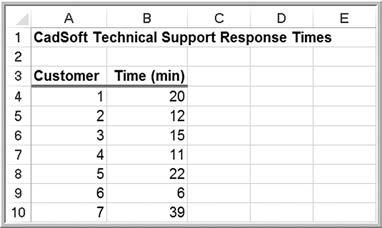
EXAMPLE 7.2 Formulating a One-Sample CadSoft, a producer of computer-aided design software for the aerospace industry, receives numerous calls for technical support. In the past, the average response time has been at least 25 minutes. The company has upgraded its information systems and believes that this will help reduce response time. As a result, it believes that the aver- age response time can be reduced to less than 25 minutes. The company collected a sample of 44 response times in the Excel file CadSoft Technical Support Response Times (see Figure 7.1). If the new information system makes a difference, then data should be able to confirm that the mean response Test of Hypothesis time is less than 25 minutes; this defines the alternative hypothesis, H. Therefore, the proper statements of the null and alter- native hypotheses are Ho: population mean response time 25 minutes H: population mean response time < 25 minutes We would typically write this using the proper symbol for the population parameter. In this case, letting u be the mean response time, we would write: : = 25 H: < 25
Step by Step Solution
3.41 Rating (160 Votes )
There are 3 Steps involved in it
To propose interesting hypothesis tests for the TV Viewing Survey data in the Excel file we need to identify variables in the data that we can analyze and make comparisons From the given data it appea... View full answer

Get step-by-step solutions from verified subject matter experts