

Question: Use the profit model developed in Example 12.1 to implement a financial simulation model for a new product proposal and determine a distribution of profits
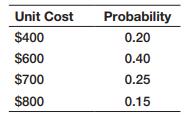
Use the profit model developed in Example 12.1 to implement a financial simulation model for a new product proposal and determine a distribution of profits using the discrete distributions below for the unit cost, demand, and fixed costs. Price is fixed at $1,000. Unit costs are unknown and follow the distribution
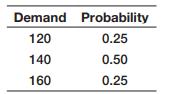
Demand is also variable and follows the following distribution:
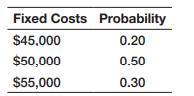
Fixed costs are estimated to follow the distribution
Simulate this model for 50 trials and a production quantity of 140. What is the average profit?
Data from Example 12.1
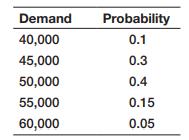
In Chapter 11 (Example 11.4), we developed a simple spreadsheet model for computing profit. The model is shown again in Figure 12.1. Suppose that the demand, unit cost, and fixed cost are uncertain. Historical data for the demand might suggest a probability distribution with the following values:
This is a simple discrete probability distribution. For the unit cost, managers might only know that it might vary between $22 and $26; thus, a uniform distribution would be an appropriate distribution to model this. They might also estimate that the fixed cost might be as low as $350,000 or as high as $500,000, with the most likely value being $400,000. In this case, a triangular distribution can be used.
If values from these distributions are generated randomly in the appropriate cells of the spreadsheet, the value of profit will also change. By repeating this many times, we will obtain a probability distribution of profit; this is the essence of Monte Carlo simulation.
Unit Cost $400 $600 $700 $800 Probability 0.20 0.40 0.25 0.15
Step by Step Solution
3.39 Rating (155 Votes )
There are 3 Steps involved in it
Data Unit Price 1000 Unit Cost 60000 Fixed Cost 5000000 Demand 160 Model Unit Price 1000 Quantity S... View full answer

Get step-by-step solutions from verified subject matter experts