

Question: Why is a visualization of sensitivity analysis easier to interpret than a table of sensitivity analysis? Stock Intrinsic Value per Share $600.00 $500.00 $400.00 $300.00
Why is a visualization of sensitivity analysis easier to interpret than a table of sensitivity analysis?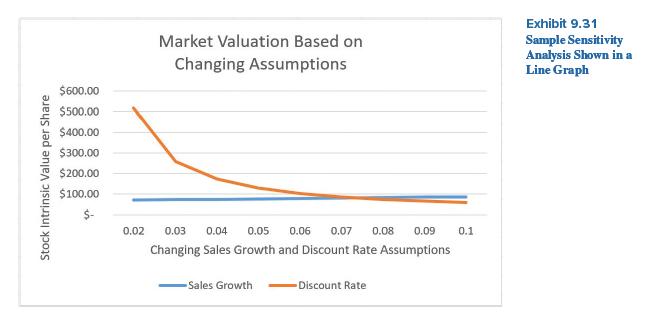
Stock Intrinsic Value per Share $600.00 $500.00 $400.00 $300.00 $200.00 $100.00 Market Valuation Based on Changing Assumptions 0.02 0.03 0.04 0.05 0.06 0.07 0.08 0.09 Changing Sales Growth and Discount Rate Assumptions Sales Growth -Discount Rate Exhibit 9.31 Sample Sensitivity Analysis shown in a Line Graph
Step by Step Solution
★★★★★
3.33 Rating (159 Votes )
There are 3 Steps involved in it
1 Expert Approved Answer
Step: 1 Unlock

Trends are often easier to see ... View full answer
Question Has Been Solved by an Expert!
Get step-by-step solutions from verified subject matter experts
Step: 2 Unlock
Step: 3 Unlock