

Review the chart in Figure 19. How could the data be presented in a better way to
Question:
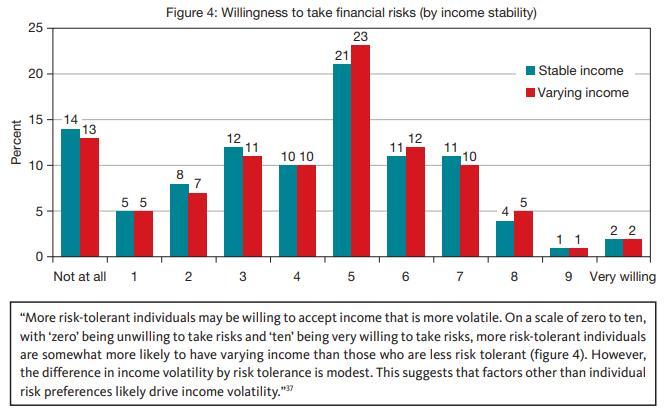
Review the chart in Figure 19. How could the data be presented in a better way to improve comprehension? Also include a more descriptive title to summarize the main point. Redraw the chart and compare your approach with that of other students.
Figure 19
Fantastic news! We've Found the answer you've been seeking!
Step by Step Answer:

Answered By
Mugdha Sisodiya
My self Mugdha Sisodiya from Chhattisgarh India. I have completed my Bachelors degree in 2015 and My Master in Commerce degree in 2016. I am having expertise in Management, Cost and Finance Accounts. Further I have completed my Chartered Accountant and working as a Professional.
Since 2012 I am providing home tutions.
2+ Reviews
10+ Question Solved
Related Book For 
Question Posted:
