

The textbooks Web site provides an interactive Contribution Margin Chart. This chart presents a pictorial display of
Question:
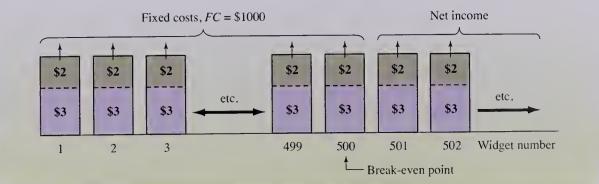
The textbook’s Web site provides an interactive Contribution Margin Chart. This chart presents a pictorial display of the components of total cost and total revenue from a contribution margin point of view.
Contribution Margin Chart:
Fantastic news! We've Found the answer you've been seeking!
Step by Step Answer:
it appears to be a contribution margin chart for a company that produces widgets The chart shows the ...View the full answer

Answered By
Muhammad Umair
I have done job as Embedded System Engineer for just four months but after it i have decided to open my own lab and to work on projects that i can launch my own product in market. I work on different softwares like Proteus, Mikroc to program Embedded Systems. My basic work is on Embedded Systems. I have skills in Autocad, Proteus, C++, C programming and i love to share these skills to other to enhance my knowledge too.
1+ Reviews
10+ Question Solved
Related Book For 

Question Posted:
