

Question: Consider testing H 0 : 1 = 0 versus Ha: 1 0. Figure 14.11 tells us that t = 14.44 and that
Consider testing H0: β1 = 0 versus Ha: β1 ≠ 0. Figure 14.11 tells us that t = 14.44 and that the related p-value is less than .001. Assuming that the bivariate normal probability distribution assumption holds, test H0: p = 0 versus Ha: p ≠ 0 by setting a equal to .05, .01, and .001. What do you conclude about how x and y are related?
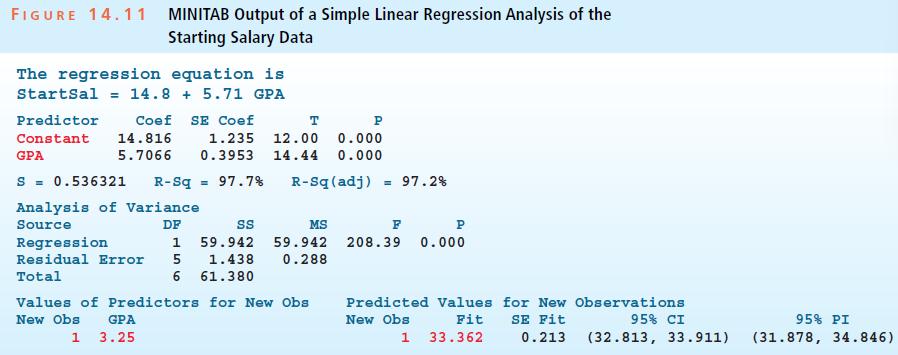
FIGURE 14.11 MINITAB Output of a Simple Linear Regression Analysis of the Starting Salary Data The regression equation is Startsal = 14.8+5.71 GPA Coef SE Coef T P 1.235 12.00 0.000 5.7066 0.3953 14.44 0.000 Predictor Constant 14.816 GPA S = 0.536321 R-Sq 97.7% R-Sq(adj) = 97.2% Analysis of Variance Source DF SS MS 1 59.942 59.942 1.438 0.288 6 61.380 Regression Residual Error 5 Total Values of Predictors for New Obs New Obs 1 GPA 3.25 P F 208.39 0.000 Predicted Values New Obs Fit 1 33.362 for New Observations SE Fit 95% CI 0.213 (32.813, 33.911) 95% PI (31.878, 34.846)
Step by Step Solution
3.56 Rating (163 Votes )
There are 3 Steps involved in it
In this context you are considering the pvalue from a simple linear regression analysis that tests t... View full answer

Get step-by-step solutions from verified subject matter experts