

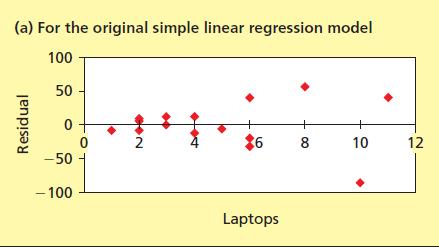
Figure 14.35(a) shows the residual plot versus x for the simple linear regression of the laptop service
Question:
Figure 14.35(a) shows the residual plot versus x for the simple linear regression of the laptop service time data. This plot fans out, indicating that the error term e tends to become larger in magnitude as x increases. To remedy this violation of the constant variance assumption, we divide all terms in the simple linear regression model by x. This gives the transformed model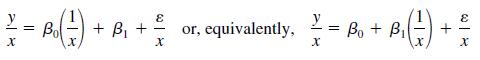
Data from Figure 14.35 (a)
Step by Step Answer:

This question has not been answered yet.
You can Ask your question!
Related Book For 

Business Statistics In Practice
ISBN: 9780077534844
7th Edition
Authors: Bruce Bowerman, Richard OConnell, Emilly Murphree
Question Posted:
