

In problems 12.8, 12.20, 12.30, 12.46, 12.62, 12.82, and 12.83, you developed regression models to predict franchise
Question:
In problems 12.8, 12.20, 12.30, 12.46, 12.62, 12.82, and 12.83, you developed regression models to predict franchise value of major league baseball, NBA basketball, and soccer teams. Now, write a report based on the models you developed. Append to your report all appropriate charts and statistical information.
Problems 12.8:
In problem 12.82 you used annual revenue to develop a model to predict the franchise value of National Basketball Association (NBA) teams. Can you also use the annual revenues generated by European soccer teams to predict franchise values? (European soccer team values and revenues are stored in SoccerValues2014 .)
a. Repeat problem 12.82 (a) through (h) for the European soccer teams.
b. Compare the results of (a) to those of baseball franchises in problems 12.8, 12.20, 12.30, 12.46, and 12.62 and NBA franchises in problem 12.82.
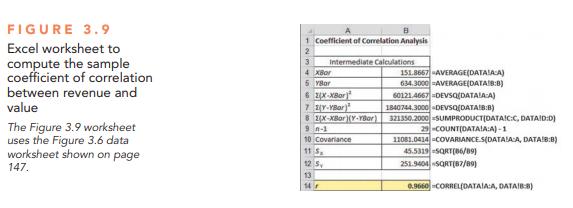
Can you use the annual revenues generated by National Basketball Association (NBA) franchises to predict franchise values? Figure 2.14 on page 83 shows a scatter plot of revenue with franchise value, and Figure 3.9 on page 186, shows the correlation coefficient. Now, you want to develop a simple linear regression model to predict franchise values based on revenues. (Franchise values and revenues are stored in nbaValues .)
a. Assuming a linear relationship, use the least-squares method to compute the regression coefficients b0 and b1.
b. Interpret the meaning of the Y intercept, b0, and the slope, b1, in this problem.
c. predict the mean value of an NBA franchise that generates $150 million of annual revenue.
d. Compute the coefficient of determination, r2 , and interpret its meaning.
e. perform a residual analysis on your results and evaluate the regression assumptions.
f. At the 0.05 level of significance, is there evidence of a linear relationship between the annual revenues generated and the value of an NBA franchise?
g. Construct a 95% confidence interval estimate of the mean value of all NBA franchises that generate $150 million of annual revenue.
h. Construct a 95% prediction interval of the value of an individual NBA franchise that generates $150 million of annual revenue.
i. Compare the results of (a) through (h) to those of baseball franchises in problems 12.8, 12.20, 12.30, 12.46, and 12.62 and European soccer teams in problem 12.83.
Figure 2.14:
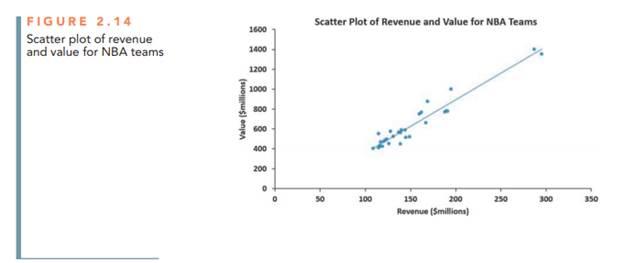
Figure 3.9:
Step by Step Answer:

This question has not been answered yet.
You can Ask your question!


Business Statistics A First Course
ISBN: 9780321979018
7th Edition
Authors: David M. Levine, Kathryn A. Szabat, David F. Stephan
