

Question: Using a table of random numbers (Table E.1), simulate the selection of different-colored balls from a bowl, as follows: 1. Start in the row corresponding
Using a table of random numbers (Table E.1), simulate the selection of different-colored balls from a bowl, as follows:
1. Start in the row corresponding to the day of the month in which you were born.
2. Select one-digit numbers.
3. If a random digit between 0 and 6 is selected, consider the ball white; if a random digit is a 7, 8, or 9, consider the ball red.
Select samples of n = 10, n = 25, and n = 50 digits. In each sample, count the number of white balls and compute the proportion of white balls in the sample. If each student in the class selects five different samples for each sample size, a frequency distribution of the proportion of white balls (for each sample size) can be developed from the results of the entire class. What conclusions can you reach about the sampling distribution of the proportion as the sample size is increased?
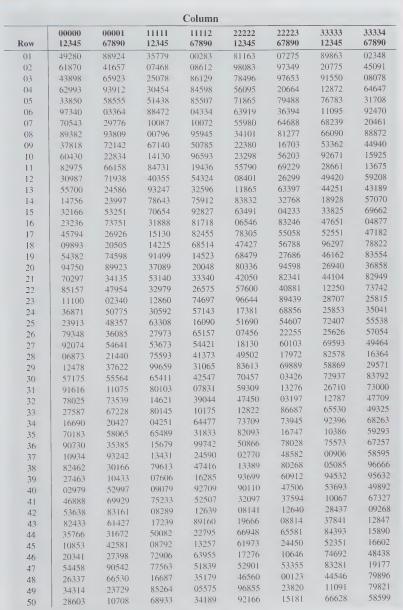
Table E.1:
Step by Step Solution
3.27 Rating (153 Votes )
There are 3 Steps involved in it
To simulate the selection of differentcolored balls from a bowl based on the given i... View full answer

Get step-by-step solutions from verified subject matter experts