

We give MINITAB and Excel outputs of simple linear regression analyses of the data sets related to
Question:
We give MINITAB and Excel outputs of simple linear regression analyses of the data sets related to six previously discussed case studies. Using the appropriate computer output,
a. Use the explained variation and the unexplained variation as given on the computer output to calculate (within rounding) the F(model) statistic.
b. Utilize the F(model) statistic and the appropriate critical value to test H0: β1= 0 versus Ha: β1 ≠ 0 by setting α equal to .05. What do you conclude about the regression relationship between y and x?
c. Utilize the F(model) statistic and the appropriate critical value to test H0: β1= 0 versus Ha: β1 ≠ 0 by setting a equal to .01. What do you conclude about the regression relationship between y and x?
d. Find the p-value related to F(model) on the computer output and report its value. Using the p-value, test the significance of the regression model at the .10, .05, .01, and .001 levels of significance. What do you conclude?
e. Show that the F(model) statistic is (within rounding) the square of the t statistic for testing H0: β1= 0 versus Ha: β1≠ 0. Also, show that the F.05 critical value is the square of the t.025 critical value.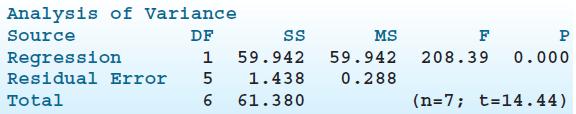
Step by Step Answer:
a F 59942 1438 5 20839 b F 05 661 df 1 1 df 2 5 Since 20839 661 reject H 0 with strong evidenc...View the full answer


Business Statistics In Practice
ISBN: 9780077534844
7th Edition
Authors: Bruce Bowerman, Richard OConnell, Emilly Murphree
