

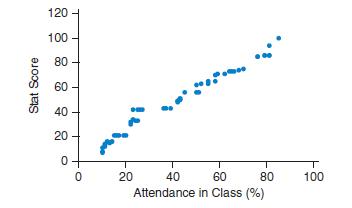
Question: 4.13 Statistics Score and B.Stat a. The first scatterplot shows scores in statistics and attendance of students majoring in statistics in a college. Would it
4.13 Statistics Score and B.Stat
a. The first scatterplot shows scores in statistics and attendance of students majoring in statistics in a college. Would it make sense to find the correlation using this data set? Why or why not?
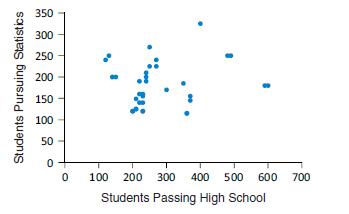
b. The second scatterplot shows the number of students passing high school examinations and the number of students pursuing higher studies in statistics. Would it make sense to find the correlation using this data set? Why or why not?
Stat Score 60 40 20 0 8882 120 100 80 0 20 40 60 Attendance in Class (%) 80 100
Step by Step Solution
There are 3 Steps involved in it
1 Expert Approved Answer
Step: 1 Unlock

Question Has Been Solved by an Expert!
Get step-by-step solutions from verified subject matter experts
Step: 2 Unlock
Step: 3 Unlock