

Question: 4.39 Monthly Shopping and Weight The figure shows a scatterplot of the monthly shopping (in $) and weights (in kg) of some residents in a
4.39 Monthly Shopping and Weight The figure shows a scatterplot of the monthly shopping (in $) and weights (in kg) of some residents in a locality.
a. If a regression line were drawn on this graph, would it have a positive slope, a negative slope, or a slope near 0?
b. Give an estimate of the numerical value of correlation between monthly shopping and weight.
c. Explain what this graph tells us about the relation between monthly shopping and weight.
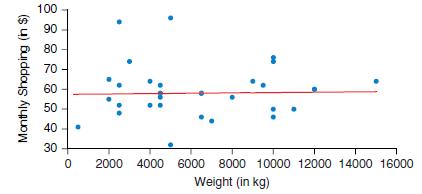
Monthly Shopping (in $) 70- 88888 100 90 80 60 50 40 30 0 2000 4000 6000 8000 10000 12000 14000 16000 Weight (in kg)
Step by Step Solution
There are 3 Steps involved in it
1 Expert Approved Answer
Step: 1 Unlock

Question Has Been Solved by an Expert!
Get step-by-step solutions from verified subject matter experts
Step: 2 Unlock
Step: 3 Unlock