

Apple Inc. has performed extremely well in the last decade. After its stock price dropping to below
Question:
Apple Inc. has performed extremely well in the last decade. After its stock price dropping to below 90 in May 2016, it made a tremendous come back to reach about 146 by May 2017 (SeekingAlpha.com, May 1, 2017). An investor seeking to gain from the positive momentum of Apple’s stock price analyzes 53 weeks of stock price data from 5/30/16 to 5/26/17. A portion of the data is shown in the accompanying table.
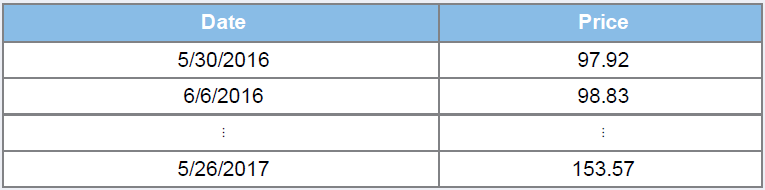
a. Plot the stock price data with superimposed linear and exponential trends. Which trend do you think describes the data better?
b. Estimate the linear and the exponential trend models. Use MSE to select the best model for making forecasts.
c. Make a forecast with the chosen model for the next week (54th week).
Step by Step Answer:
a Let y t represent the stock price of Apple over time t 1 2 53 Series y t with superim...View the full answer


Business Statistics Communicating With Numbers
ISBN: 9781259957611
3rd Edition
Authors: Sanjiv Jaggia
