

The following table shows the revenues (in $ millions) for Firm 1 and Firm 2 over the
Question:
The following table shows the revenues (in $ millions) for Firm 1 and Firm 2 over the past three years.
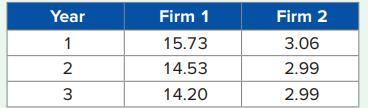
a. Calculate the average growth rate for each firm.
b. Which firm had the higher growth rate over this period?
Fantastic news! We've Found the answer you've been seeking!
Step by Step Answer:
a b Firm 2s growth is less n...View the full answer

Answered By
PALASH JHANWAR
I am a Chartered Accountant with AIR 45 in CA - IPCC. I am a Merit Holder ( B.Com ). The following is my educational details.
PLEASE ACCESS MY RESUME FROM THE FOLLOWING LINK: https://drive.google.com/file/d/1hYR1uch-ff6MRC_cDB07K6VqY9kQ3SFL/view?usp=sharing
3+ Reviews
10+ Question Solved
Related Book For 
Business Statistics Communicating With Numbers
ISBN: 9781260716306
4th Edition
Authors: Sanjiv Jaggia, Alison Kelly
Question Posted:
