

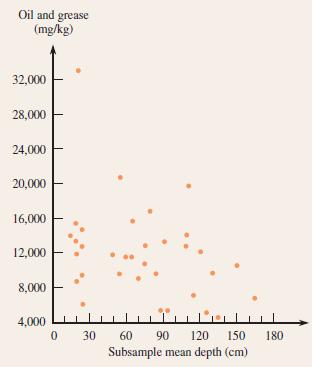
Question: 13.65 The accompanying scatterplot, based on 34 sediment samples with x 5 sediment depth (cm) and y 5 oil and grease content (mg/kg), appeared in
13.65 The accompanying scatterplot, based on 34 sediment samples with x 5 sediment depth (cm) and y 5 oil and grease content (mg/kg), appeared in the article
“Mined Land Reclamation Using Polluted Urban Navigable Waterway Sediments” (Journal of Environmental Quality [1984]: 415–422). Discuss the effect that the observation (20, 33,000) will have on the estimated regression line. If this point were omitted, what can you say about the slope of the estimated regression line?
What do you think will happen to the slope if this observation is included in the computations?
Oil and grease (mg/kg) 32,000 28,000 24,000 20,000 16,000 12,000 8,000 4,000 0 30 60 90 120 150 180 Subsample mean depth (cm)
Step by Step Solution
There are 3 Steps involved in it

Get step-by-step solutions from verified subject matter experts