

Question: A study looking at the relationship between the Temperature (C) of a place and Time (i.e., on an hourly basis) produced the following scatterplot. A
A study looking at the relationship between the Temperature
(°C) of a place and Time (i.e., on an hourly basis) produced the following scatterplot. A linear regression was fit to the data as shown below.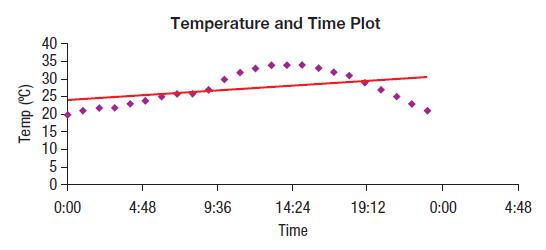
On the basis of this plot, would you advise using this regression? Explain.
40 35 30- 8 25 Temp (C) 20 15 10 Temperature and Time Plot 5- 0 0:00 4:48 9:36 14:24 19:12 0:00 4:48 Time
Step by Step Solution
There are 3 Steps involved in it
1 Expert Approved Answer
Step: 1 Unlock

Question Has Been Solved by an Expert!
Get step-by-step solutions from verified subject matter experts
Step: 2 Unlock
Step: 3 Unlock