

Question: Employment in different areas, part 2. Here is the scatterplot of the residuals against predicted values for the regression model found in Exercise 17. a)
Employment in different areas, part 2.
Here is the scatterplot of the residuals against predicted values for the regression model found in Exercise 17.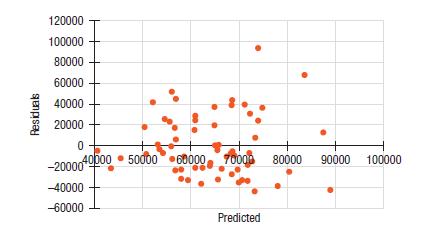
a) The two extraordinary points at the upper right are from the District of Columbia. Interpret these points.
b) Do you think this area are likely to be inf luential in the regression? Would setting them aside be likely to change the coefficients? What other statistics might help you decide?
Residuals 120000 100000 80000 60000 40000 20000 0 -20000 40000 50000 60000 70000 -40000 -60000 Predicted 80000 90000 100000
Step by Step Solution
There are 3 Steps involved in it
1 Expert Approved Answer
Step: 1 Unlock

Question Has Been Solved by an Expert!
Get step-by-step solutions from verified subject matter experts
Step: 2 Unlock
Step: 3 Unlock