

Shown here is a scatter plot of the NASDAQ 100 Index versus the Dow Jones Industrial Average
Question:
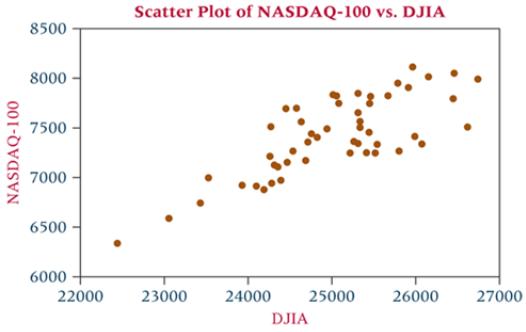
Shown here is a scatter plot of the NASDAQ 100 Index versus the Dow Jones Industrial Average on Friday closings over a period of one year (January 12, 2018 to January 4, 2019). What does the graph tell you about the relationship of the NASDAQ 100 Index to the Dow Jones Industrial Average? Explain what you observe in the graph and share any conclusions that you reach. The NASDAQ 100 data were obtained from the Federal Reserve Bank of St. Louis, and the Dow Jones Industrial Averages were obtained from measuringworth.com.
Fantastic news! We've Found the answer you've been seeking!
Step by Step Answer:
There appears to be a relatively strong positive rel...View the full answer

Answered By
Albert Kinara
i am an expert research writer having worked with various online platform for a long time. i also work as a lecturer in business in several universities and college part time and assure you well researched and articulate papers. i have written excellent academic papers for over 5 year and have an almost similar experience experting many clients in different units. bachelor of commerce (finance)
masters in strategic management
phd finance
26+ Reviews
48+ Question Solved
Related Book For 

Business Statistics For Contemporary Decision Making
ISBN: 9781119607458
10th Edition
Authors: Ken Black
Question Posted:
