

Question: The Center for Science in the Public Interest evaluated school cafeterias in 20 school districts across the United States. Each district was assigned a numerical
The Center for Science in the Public Interest evaluated school cafeterias in 20 school districts across the United States. Each district was assigned a numerical score on the basis of rigor of food codes, frequency of food safety inspections, access to inspection information, and the results of cafeteria inspections. Based on the score assigned, each district was also assigned one of four grades. The scores and grades are summarized in the accompanying table, which appears in the report “Making the Grade: An Analysis of Food Safety in School Cafeterias” (cspi.us/
new/pdf/makingthegrade.pdf, 2007).
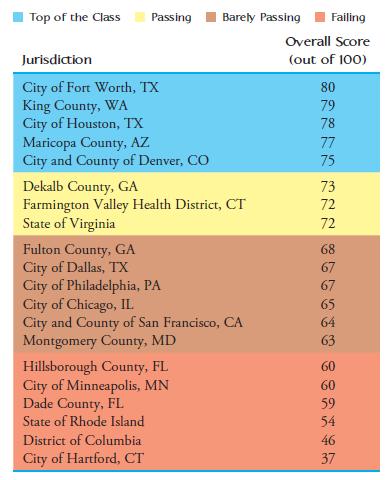
a. Two variables are summarized in the figure, grade and overall score. Is overall score a numerical or categorical variable? Is grade (indicated by the different colors in the figure) a numerical or categorical variable?
b. Explain how the figure is equivalent to a segmented bar graph of the grade data.
c. Construct a dotplot of the overall score data. Based on the dotplot, suggest an alternate assignment of grades (top of class, passing, etc.) to the 20 school districts. Explain the reasoning you used to make your assignment.
Top of the Class Passing Barely Passing Failing Overall Score (out of 100) Jurisdiction City of Fort Worth, TX King County, WA City of Houston, TX Maricopa County, AZ City and County of Denver, CO Dekalb County, GA Farmington Valley Health District, CT State of Virginia Fulton County, GA City of Dallas, TX City of Philadelphia, PA City of Chicago, IL City and County of San Francisco, CA Montgomery County, MD Hillsborough County, FL City of Minneapolis, MN Dade County, FL State of Rhode Island District of Columbia City of Hartford, CT 80 79 78 77 75 73 72 72 KKK 22 8666 67 67 65 64 63 60 60 59 54 46 37
Step by Step Solution
There are 3 Steps involved in it

Get step-by-step solutions from verified subject matter experts