

Question: A residual plot from the least-squares regression is shown below. Which of the following statements is supported by the graph? (a) The residual plot contains
A residual plot from the least-squares regression is shown below. Which of the following statements is supported by the graph?
(a) The residual plot contains dramatic evidence that the standard deviation of the response about the population regression line increases as the average number of putts per round increases.
(b) The sum of the residuals is not 0. Obviously, there is a major error present.
(c) Using the regression line to predict a player’s total winnings from his average number of putts almost always results in errors of less than $200,000.
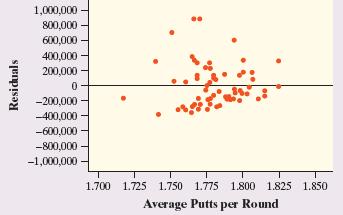
(d) For two players, the regression line underpredicts their total winnings by more than $800,000.
(e) The residual plot reveals no correlation between average putts per round and prediction errors from the least-squares line for these players.
Residuals 1,000,000 800,000 600,000 400,000 200,000 0 -200,000 -400,000 -600,000 -800,000 -1,000,000 1.700 1.725 1.750 1.775 1.800 1.825 1.850 Average Putts per Round
Step by Step Solution
3.39 Rating (149 Votes )
There are 3 Steps involved in it

Get step-by-step solutions from verified subject matter experts